A volume profile indicator is a charting technique that displays the amount of total stock or share traded for a security at different price levels during a trading session. It can be used in conjunction with other technical tools as part of a trading strategy.
Traders use the information contained within a volume profile to identify key support and resistance levels. They can also gain a better understanding of market activity by analyzing the distribution of volume and how it affects prices. Volume profiles can be created for specific time periods or for an entire trading session.
The basic idea behind a volume profile is that the market is a never-ending auction process in which sellers and buyers attempt to find a match. As a result, certain price levels attract more sellers or buyers than others, and the resulting imbalance can lead to a reversal in trend direction. In addition, traders can also use volume profiles to confirm various price patterns, such as triangles or wedges, by looking for higher volumes during breakouts or breakdowns.
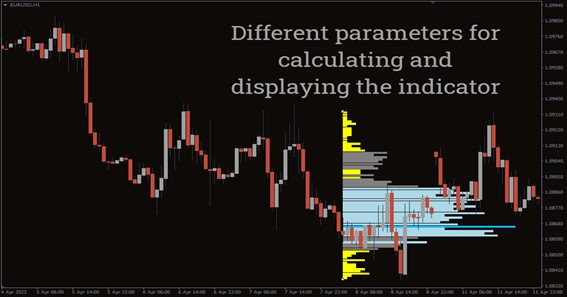
There are a variety of ways to use a volume profile, with the most common being to analyze a profile for an entire trading period and to identify areas of high or low volume. In many cases, traders will look for a point of control (POC), which is the price level that attracted the highest or lowest volume. The range of prices around the POC that contains 70% of total volume is referred to as the value area and is often coloured differently for easier visualization. The POC and the value area often act as significant support or resistance levels.
Alternatively, traders may choose to create a volume profile for a particular timeframe and then use the information gathered to determine the most likely support or resistance levels. In doing so, they will look for volume clusters, which are areas of concentrated volume that often act as strong support or resistance levels. They will then watch for the price to approach these support or resistance levels and look for potential trade entries.
A disadvantage of using a volume profile is that it can only show the amount of volume traded over a specified timeframe and price range. As a result, it may not be as effective in markets with low trading volume. Additionally, since the volume profile is based on historical data, it can be difficult to interpret in real-time.
To get the most out of a volume profile indicator it is best to use it in conjunction with other indicators and techniques. For example, fundamental analysis of earnings reports or economic data can help traders identify trading opportunities by comparing them with the information contained in a volume profile. By combining these tools, traders can gain a more comprehensive view of the market and make more informed trading decisions.